Grafana Dashboards for Awa
Two dashboards are provided:
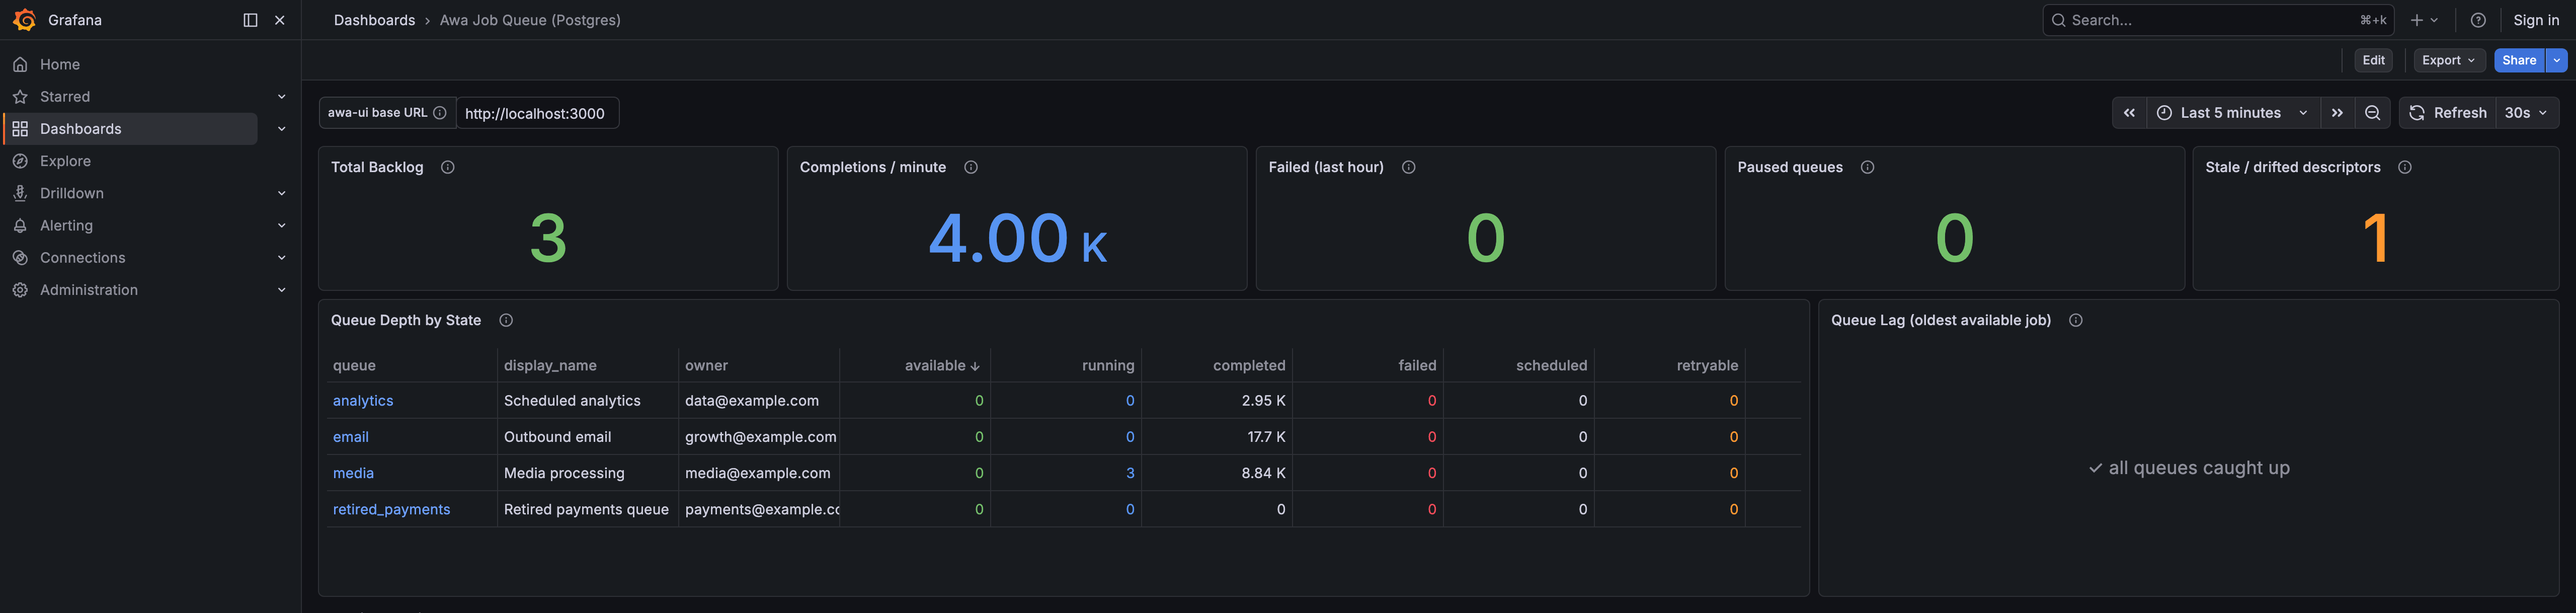
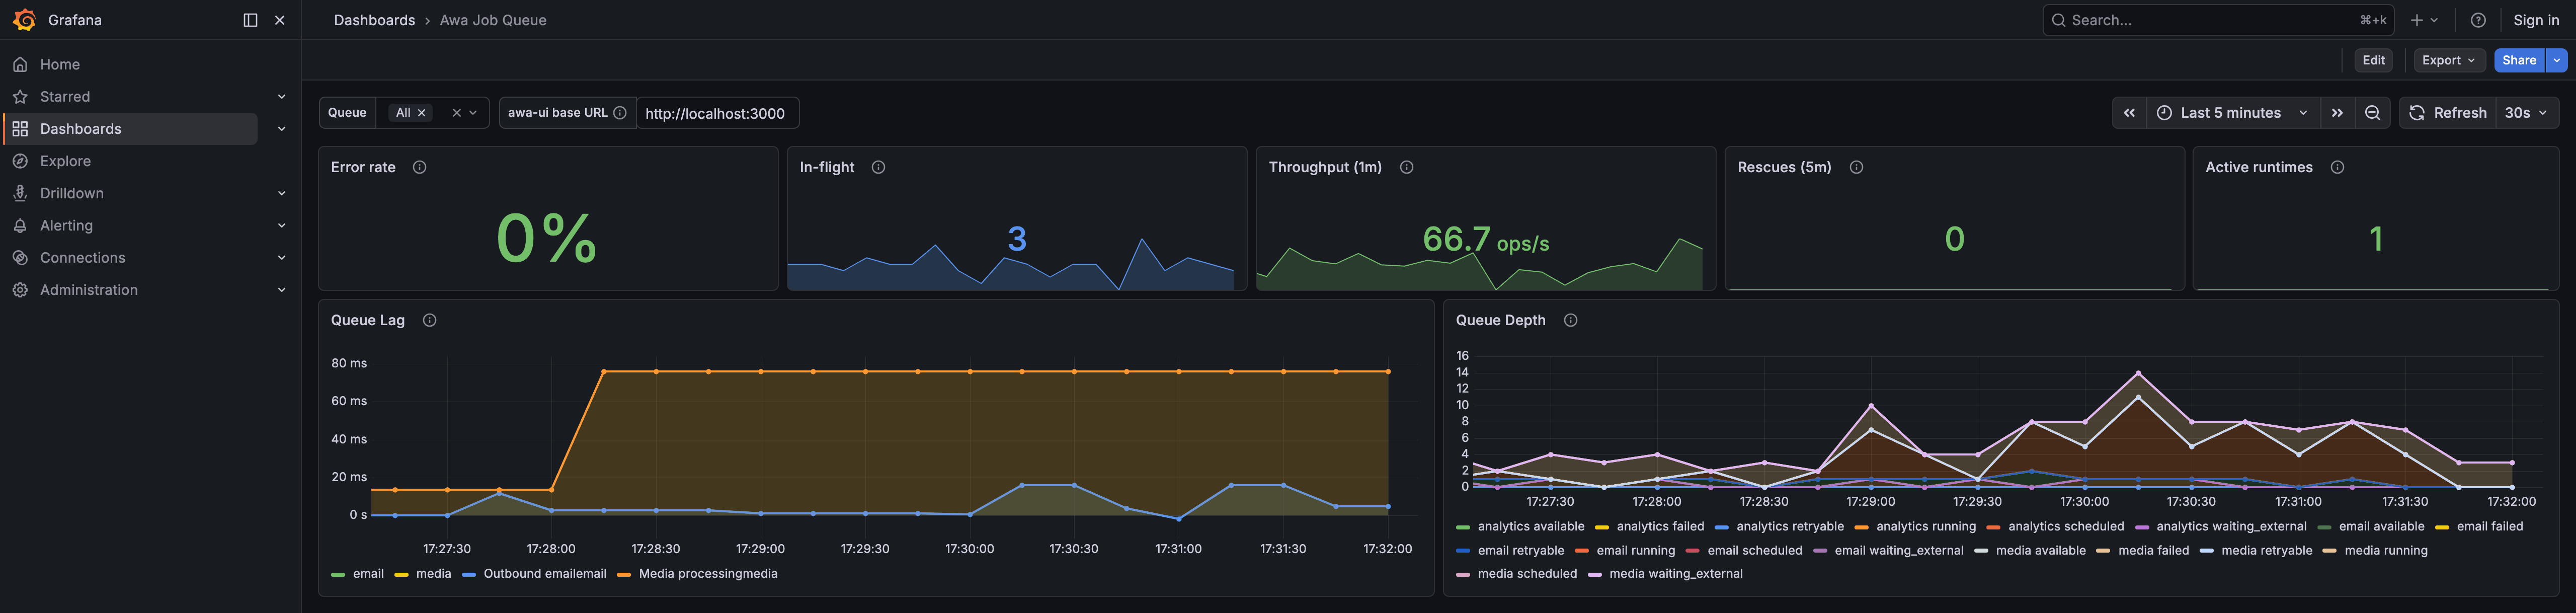
awa-dashboard.json— Prometheus / OTel metrics dashboard. Requires an OTLP collector (e.g., Grafana LGTM, Prometheus + OTLP receiver). Shows time-series metrics: throughput, latency, queue depth, rescues, completion flush performance.awa-dashboard-postgres.json— SQL dashboard querying Postgres directly. No collector needed. Shows queue depth, lag, descriptor health, recent failures, cron schedules, and runtime instances. Queue depth and backlog panels read fromqueue_state_counts(cache table, eventually consistent within the ~2s dirty-key recompute window). Lag and recent-failure panels read through theawa.jobscompatibility view, so they follow the active queue-storage schema instead of assumingjobs_hotis the live worker engine. Queue-related tables LEFT JOINqueue_descriptorsso declared display names and owners appear alongside raw queue names, and declared-but-idle queues stay visible. The Descriptor Health panel surfaces stale and drifted descriptors (seedocs/architecture.md#descriptors-and-runtime-livenessfor the model); an empty table = healthy fleet.
Previews (live demo workload, both dashboards rendered against a local grafana/otel-lgtm collector + Postgres):
| Postgres | OTel / Prometheus |
|---|---|
 |
 |
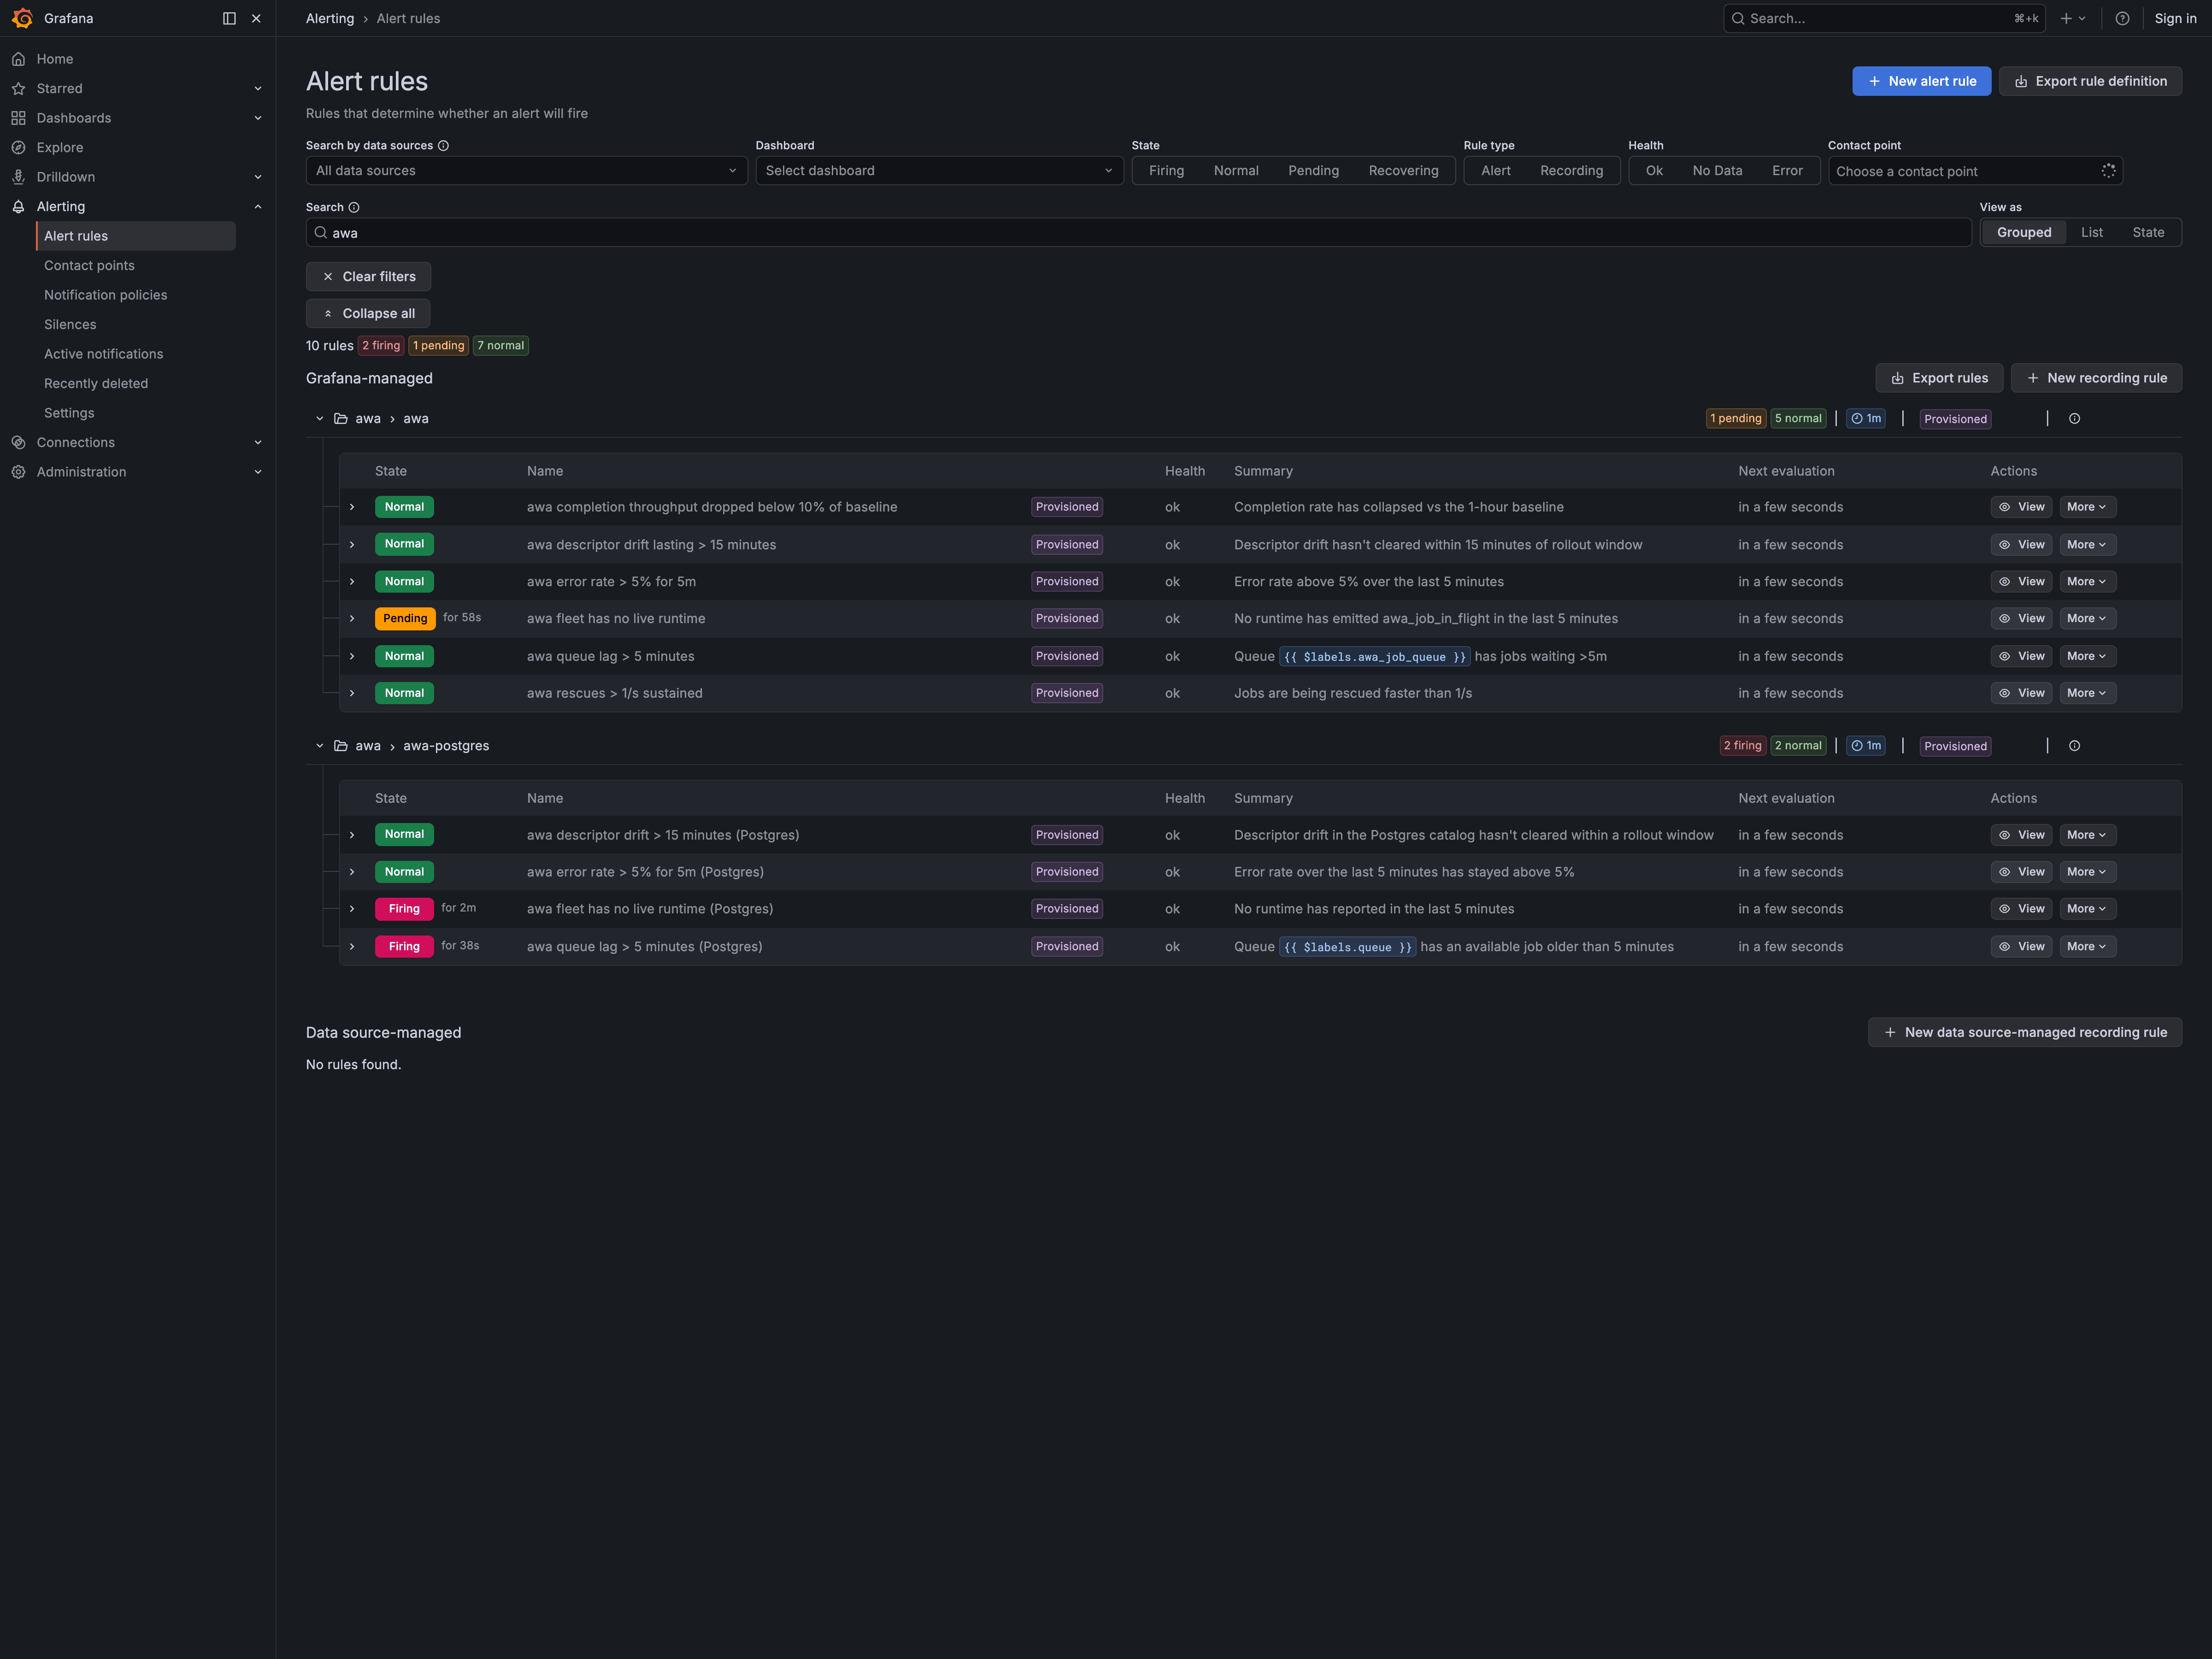
Alert rules (see the alert provisioning guide) import as Grafana unified-alerting file provisioning. Here's the rule browser after provisioning both variants, with the "no active runtime (Postgres)" rule firing after we stopped the demo worker:
Descriptor metrics on the OTel dashboard
The Prometheus / OTel dashboard surfaces descriptors via two info-style gauges the runtime emits every snapshot tick:
awa_queue_info{awa_job_queue, awa_queue_display_name, awa_queue_owner, awa_queue_tags, awa_queue_docs_url, awa_queue_description}— always 1awa_job_kind_info{awa_job_kind, awa_job_kind_display_name, awa_job_kind_owner, ...}— always 1
This is the idiomatic Prometheus/OTel pattern (same shape as kube-state-metrics kube_deployment_labels): the value is a constant and the descriptor fields live in the label set. That keeps cardinality under control — you don't want display_name as a label on every awa_job_completed_total sample, because a rolling descriptor change would split every metric into new time series. Dashboards lift descriptor fields into panels at query time via a group_left join:
sum by (awa_job_queue, awa_queue_display_name) (
    rate(awa_job_completed_total[$__rate_interval])
    * on(awa_job_queue) group_left(awa_queue_display_name) awa_queue_info
)
The dashboard ships three example panels — Queue Descriptor Catalog, Job Kind Descriptor Catalog (both instant-query tables), and Throughput by Queue (with display names) (a live timeseries demonstrating the join). Descriptor drift / stale detection still lives on the Postgres dashboard because deriving it from metrics alone would require emitting per-runtime hash gauges, which the Postgres catalog does more cleanly.
Prometheus / OTel Dashboard
Panels
| Panel | Type | What it shows |
|---|---|---|
| Queue Lag | Time series | Age of the oldest available job per queue |
| Queue Depth | Stacked time series | Current jobs by queue and state (available, running, failed, scheduled, retryable, waiting external) |
| Job Wait Time (p50/p95/p99) | Time series | Time from job creation to claim |
| Job Throughput | Time series | Completed, failed, retried, cancelled jobs/sec |
| In-Flight Jobs | Time series | Currently executing jobs by queue (stacked) |
| Job Duration (p50/p95/p99) | Time series | Execution time percentiles by queue |
| Throughput by Kind (top 10) | Stacked bars | Completed jobs/sec by job kind (capped at 10) |
| Claim Latency | Time series | Postgres dequeue query time (p50/p95) |
| Claim Batch Size | Time series | Average jobs claimed per poll cycle |
| Maintenance Rescues | Bars | Heartbeat, deadline, callback_timeout rescues |
| Completion Flush Performance | Time series | Batch completion write latency |
| Promotion Throughput | Time series | Scheduled/retryable jobs promoted per second |
| Prune Database Phase Latency p99 | Time series | Ring prune lock, TRUNCATE, and commit latency by ring |
| Claims / Waiting External | Time series | Queue claim rate and callback-parked job rate |
| Error Rate | Stat | Failed / (completed + failed) percentage |
| Jobs In Flight | Stat | Total executing jobs with threshold colours |
| Throughput | Stat | Total completed/sec (5m average) |
| Rescues (5m) | Stat | Recent rescue count with threshold colours |
Color semantics are consistent across panels: green for healthy/fast paths, orange for warning/tail latency or retries, red for failures/high tail latency, blue for queue intake/backlog, and yellow for callback/external wait states.
Setup
1. Configure OTLP export in your worker
// In your worker binary, before starting the client:
use opentelemetry_otlp::WithExportConfig;
use opentelemetry_sdk::metrics::SdkMeterProvider;

let exporter = opentelemetry_otlp::MetricExporter::builder()
    .with_tonic()
    .with_endpoint("http://localhost:4317")
    .build()?;

let provider = SdkMeterProvider::builder()
    .with_periodic_exporter(exporter)
    .build();

opentelemetry::global::set_meter_provider(provider);
2. Import the dashboard
Option A: Grafana UI
- Open Grafana (default: http://localhost:3000)
- Go to Dashboards → Import
- Upload
awa-dashboard.json - Select your Prometheus datasource
Option B: Provisioning Copy awa-dashboard.json to your Grafana provisioning directory:
Option C: API
# The Grafana API requires a wrapper object around the dashboard JSON
curl -X POST "http://admin:admin@localhost:3000/api/dashboards/db" \
  -H "Content-Type: application/json" \
  -d "{\"dashboard\": $(cat awa-dashboard.json), \"overwrite\": true}"
3. Verify metrics are flowing
Check Prometheus has awa metrics:
Expected metrics: awa_job_completed_total, awa_job_in_flight, awa_job_duration_seconds_*, etc.
4. Traces
With trace propagation enabled (ADR-039; automatic when your producer runs
an OpenTelemetry pipeline), the runtime's send {queue} and
job.execute {kind} spans arrive alongside the metrics — browse them in
Grafana under Explore → Tempo, or search TraceQL like
{ span.messaging.system = "awa" }.
Worker-side, each dispatcher poll roots its own trace at receive {queue}
(consumer kind, same messaging attributes, so the TraceQL above finds it) and
each heartbeat tick roots one at heartbeat.tick. Both are debug, so an
info pipeline shows neither — they tick whether or not there is work, and at
the default poll interval that would be ~5 traces/s per queue-claimer. Raise the
filter when you want them; see
Worker-side traces.
Spans and log events for work on a specific queue carry both queue and the
OTel messaging.destination.name, so
{ span.messaging.destination.name = "email" } finds the messaging spans and the
queue_storage.* claim/count spans together. Bulk DLQ operations
(bulk_move_failed_to_dlq, bulk_retry_from_dlq) carry only queue, because
theirs is an optional filter rather than a destination — query those by queue.
The bare key is retained everywhere for existing queries
(#454 tracks whether it is
eventually dropped).
Keeping these assets honest
These dashboards and alert rules are validated in CI against a live LGTM
stack on every full run (scripts/validate-grafana.sh): every awa_*
identifier they reference must exist in Prometheus (or still be defined in
awa-metrics for condition-gated metrics), both dashboards must import
through the Grafana API, every Postgres panel's SQL must EXPLAIN against
a migrated schema, and a trace must be readable through Grafana's Tempo
datasource. Run the whole thing locally with scripts/telemetry-e2e-local.sh.
Metrics Reference
All metrics use the awa OTel meter name and are exported via OTLP to your configured collector.
Job lifecycle
| Metric | Type | Labels | Description |
|---|---|---|---|
awa.job.completed |
Counter | kind, queue | Jobs completed |
awa.job.failed |
Counter | kind, queue, terminal | Jobs failed |
awa.job.retried |
Counter | kind, queue | Jobs retried |
awa.completion.deadlock_retry |
Counter | kind, queue | Re-runs of a finalize transaction after Postgres aborted it as a deadlock victim (SQLSTATE 40P01); one increment per retry, up to three per completion. Any sustained rate means job transitions are waiting on each other |
awa.job.cancelled |
Counter | kind, queue | Jobs cancelled |
awa.job.claimed |
Counter | queue | Jobs claimed from DB |
awa.job.in_flight |
UpDownCounter | queue | Currently executing |
awa.job.duration |
Histogram (s) | kind, queue | Execution time |
awa.job.wait_duration |
Histogram (s) | kind, queue | Time from creation to claim; explicit buckets include 1ms, 5ms, 10ms, 25ms, 50ms, 100ms, 250ms, 500ms, and 1s |
awa.job.waiting_external |
Counter | kind, queue | Parked for callback |
Dispatcher
| Metric | Type | Labels | Description |
|---|---|---|---|
awa.dispatch.claim_batches |
Counter | queue | Claim queries |
awa.dispatch.claim_batch_size |
Histogram | queue | Jobs per claim |
awa.dispatch.claim_duration |
Histogram (s) | queue | Claim query time |
Completion batcher
| Metric | Type | Labels | Description |
|---|---|---|---|
awa.completion.flushes |
Counter | shard | Flush operations |
awa.completion.flush_batch_size |
Histogram | shard | Jobs per flush |
awa.completion.flush_duration |
Histogram (s) | shard | Flush time |
Maintenance
| Metric | Type | Labels | Description |
|---|---|---|---|
awa.maintenance.promote_batches |
Counter | state | Promotion batches |
awa.maintenance.promote_batch_size |
Histogram | state | Jobs promoted |
awa.maintenance.promote_duration |
Histogram (s) | state | Promotion time |
awa.maintenance.rescues |
Counter | rescue_kind | Jobs rescued |
awa.maintenance.prune.attempts |
Counter | ring, outcome, reason | Ring prune outcomes, including destructive pruned and no-DDL already_pruned |
awa.maintenance.prune.duration |
Histogram (s) | ring, phase | Successful destructive prune time split into lock, truncate, and commit |
Heartbeat
| Metric | Type | Labels | Description |
|---|---|---|---|
awa.heartbeat.batches |
Counter | — | Heartbeat updates |
Descriptors (info-style gauges)
Emitted on every runtime_snapshot_interval tick. Value is always 1; the useful payload is the label set. Use with group_left joins to enrich other panels (see the "Descriptor metrics on the OTel dashboard" section above).
| Metric | Type | Labels | Description |
|---|---|---|---|
awa.queue.info |
Gauge | queue, display_name?, description?, owner?, docs_url?, tags? | Declared queue descriptor (label-join target) |
awa.job_kind.info |
Gauge | kind, display_name?, description?, owner?, docs_url?, tags? | Declared job-kind descriptor (label-join target) |
Optional labels are only emitted when the corresponding descriptor field is set (no empty-string series).