Grafana Dashboards for Awa
Three dashboards are provided:
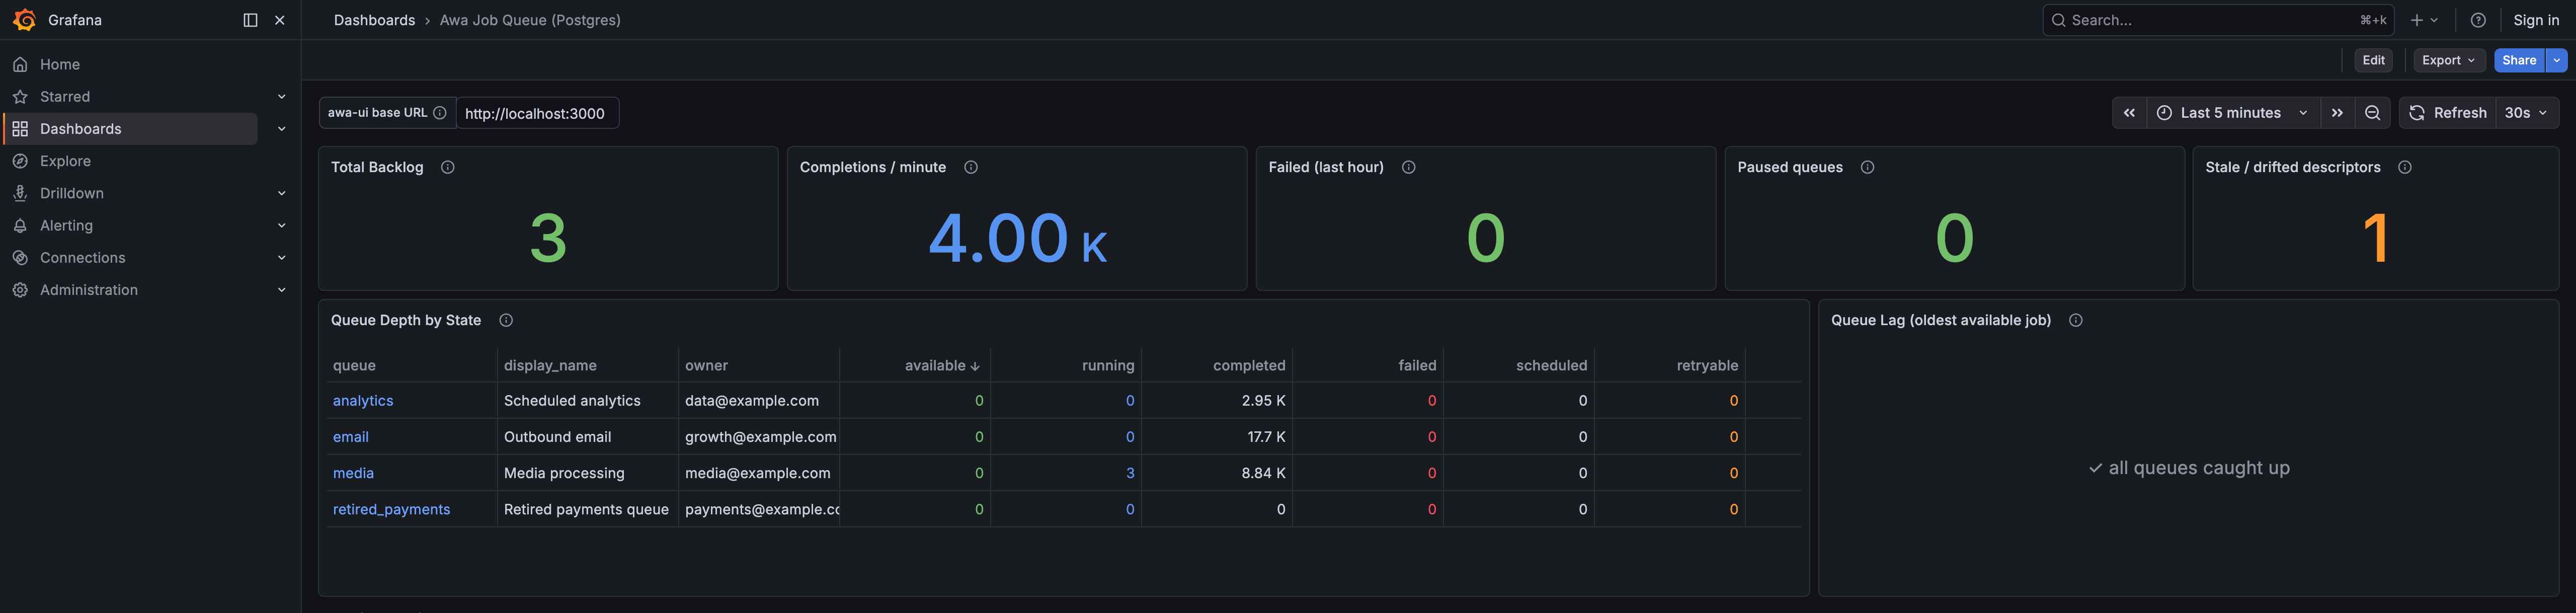
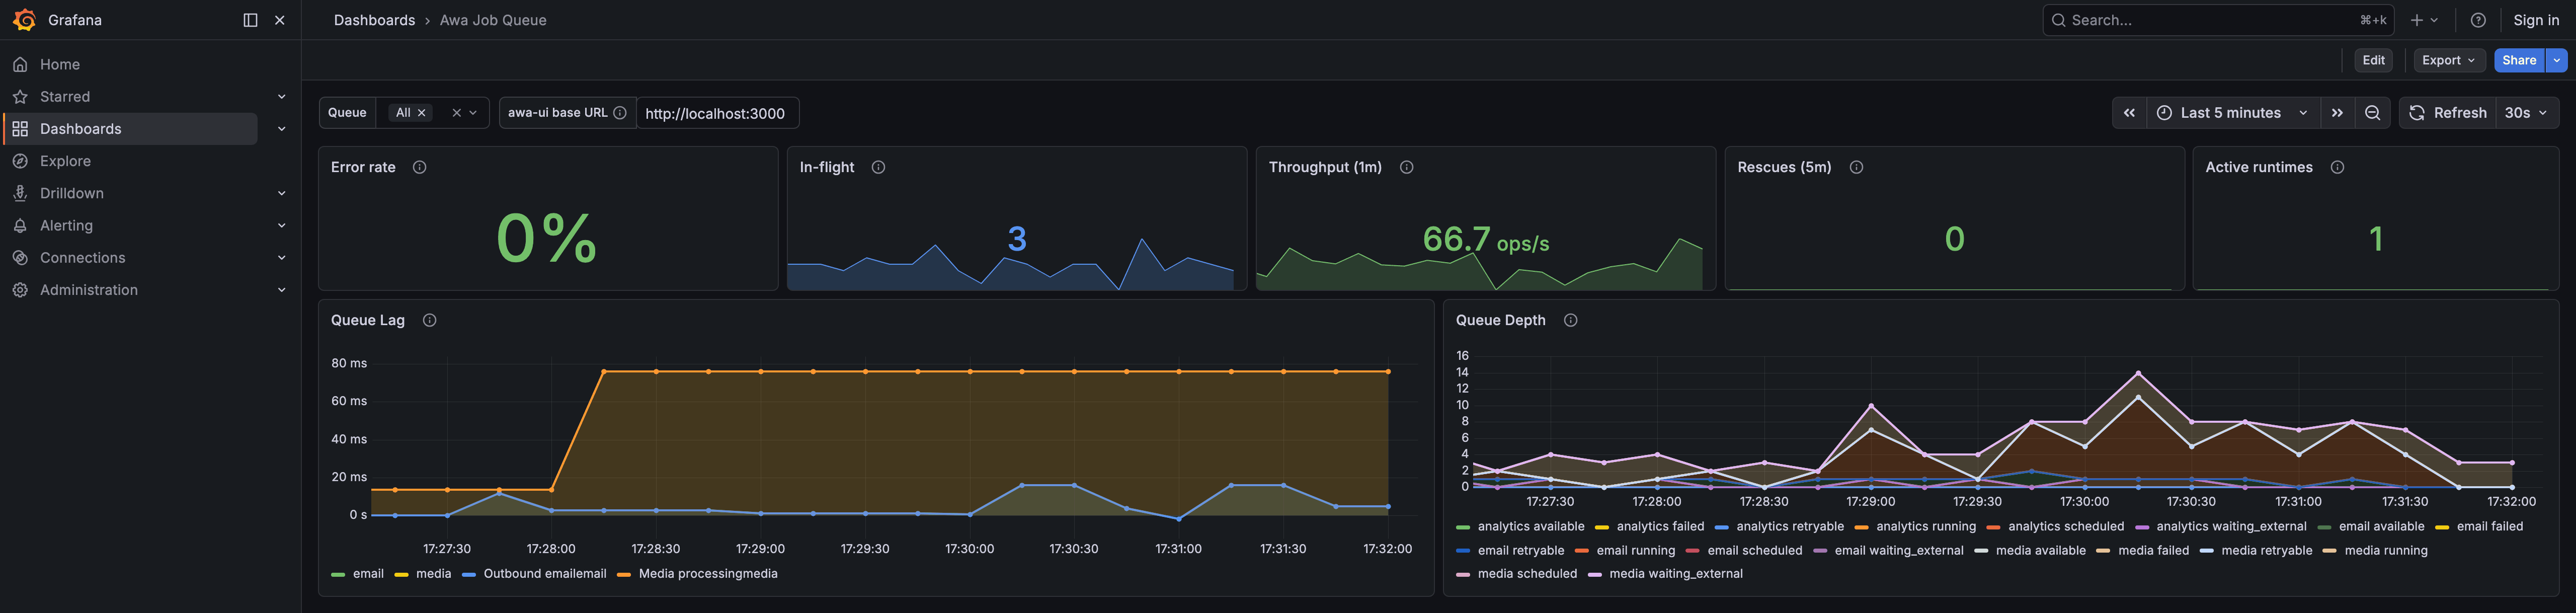
awa-dashboard.json— Prometheus / OTel fleet overview. Requires an OTLP collector (e.g., Grafana LGTM, Prometheus + OTLP receiver). Shows backlog and lag, promotion of scheduled work, throughput and failures per queue, latency, dispatcher behaviour, rescues, DLQ, maintenance leader health and ring rotation/prune.awa-queue-detail.json— Prometheus / OTel drill-down for one queue: backlog, latency, per-kind outcomes, dispatcher, DLQ and how the queue compares with its neighbours. The overview links to it from every per-queue series.awa-dashboard-postgres.json— SQL dashboard querying Postgres directly. No collector needed. Shows queue depth, lag, descriptor health, recent failures, cron schedules, and runtime instances. Queue depth and backlog panels read fromqueue_state_counts(cache table, eventually consistent within the ~2s dirty-key recompute window). Lag and recent-failure panels read through theawa.jobscompatibility view, so they follow the active queue-storage schema instead of assumingjobs_hotis the live worker engine. Queue-related tables LEFT JOINqueue_descriptorsso declared display names and owners appear alongside raw queue names, and declared-but-idle queues stay visible. The Descriptor Health panel surfaces stale and drifted descriptors (seedocs/architecture.md#descriptors-and-runtime-livenessfor the model); an empty table = healthy fleet.
Previews (live demo workload, both dashboards rendered against a local grafana/otel-lgtm collector + Postgres):
| Postgres | OTel / Prometheus |
|---|---|
 |
 |
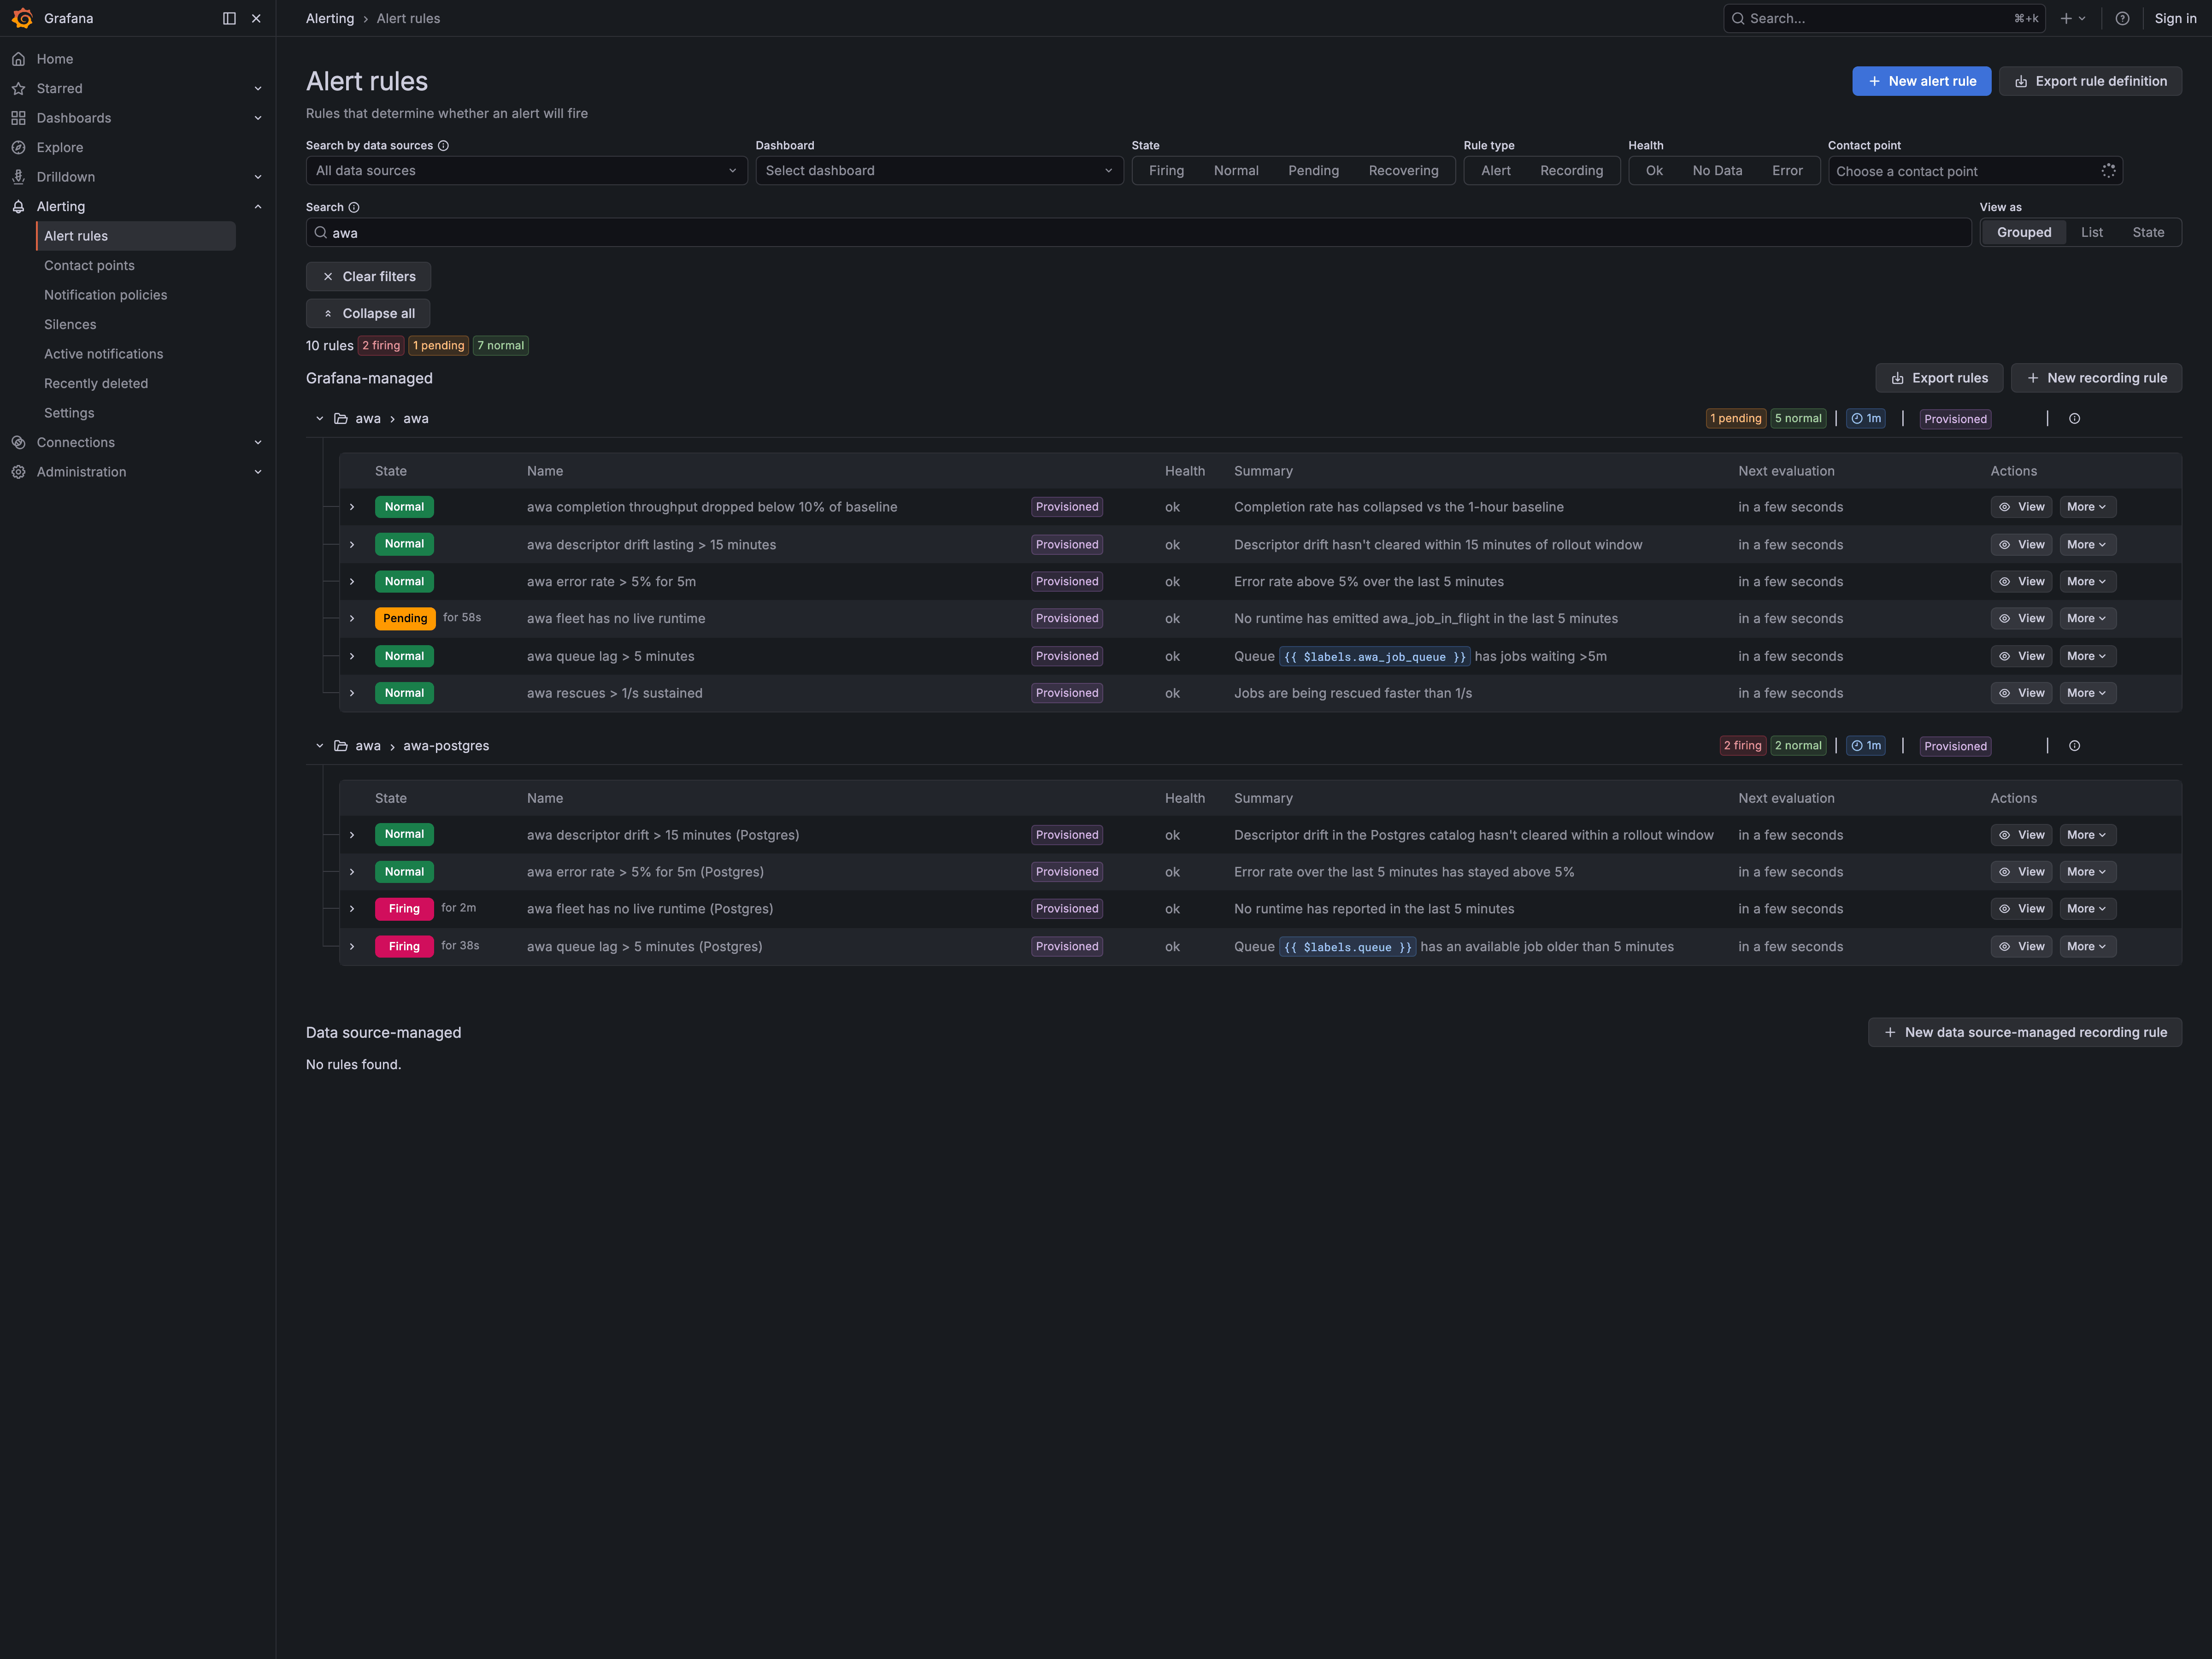
Alert rules (see the alert provisioning guide) import as Grafana unified-alerting file provisioning. Here's the rule browser after provisioning both variants, with the "no active runtime (Postgres)" rule firing after we stopped the demo worker:
Descriptor metrics on the OTel dashboard
The Prometheus / OTel dashboard surfaces descriptors via two info-style gauges the runtime emits every snapshot tick:
awa_queue_info{awa_job_queue, awa_queue_display_name, awa_queue_owner, awa_queue_tags, awa_queue_docs_url, awa_queue_description}— always 1awa_job_kind_info{awa_job_kind, awa_job_kind_display_name, awa_job_kind_owner, ...}— always 1
This is the idiomatic Prometheus/OTel pattern (same shape as kube-state-metrics kube_deployment_labels): the value is a constant and the descriptor fields live in the label set. That keeps cardinality under control — you don't want display_name as a label on every awa_job_completed_total sample, because a rolling descriptor change would split every metric into new time series. Dashboards lift descriptor fields into panels at query time via a group_left join:
sum by (awa_job_queue, awa_queue_display_name) (
    rate(awa_job_completed_total[$__rate_interval])
    * on(awa_job_queue) group_left(awa_queue_display_name) awa_queue_info
)
The dashboard ships three example panels — Queue Descriptor Catalog, Job Kind Descriptor Catalog (both instant-query tables), and Throughput by Queue (with display names) (a live timeseries demonstrating the join). Descriptor drift / stale detection still lives on the Postgres dashboard because deriving it from metrics alone would require emitting per-runtime hash gauges, which the Postgres catalog does more cleanly.
Prometheus / OTel dashboards
Template variables
Both dashboards use the same variables, so they import unmodified against any Prometheus-compatible datasource:
| Variable | Purpose |
|---|---|
datasource |
Which Prometheus-compatible datasource to query. |
queue |
Queue filter (multi-select with All on the overview, single queue on the detail dashboard). |
kind |
Job kind filter (detail dashboard). |
filters |
Ad hoc label filters applied to every query. Use it to scope to an environment, cluster, namespace or service, whatever label your metrics pipeline attaches to awa's series, for example service_name = my-worker. |
awa_ui_url |
Base URL of awa-ui for drill-through links. |
The dashboards never reference a deployment label directly, so no edit is needed when a fleet runs in several environments behind one datasource: pick the environment in filters.
Queue depth, queue lag, DLQ depth and the descriptor info gauges are published by the maintenance leader (or by every runtime, for the info gauges), so the dashboards collapse them with max by (...) to stay correct during a leader handover and when the metrics pipeline keeps per-instance labels.
Overview panels
The overview opens with fleet stats in triage order (oldest job, DLQ, error rate, throughput, in flight, deferred, rescues, runtimes; the first four carry a sparkline) followed by these rows:
| Row | What it answers |
|---|---|
| Backlog & lag | Is work waiting, and is it waiting to be claimed (lag) or to be promoted (deferred backlog against the promotion rate, batch size and duration)? |
| Throughput & failures | Which queue or kind is failing; whether one queue is crowding out others (in-flight and claims by queue). |
| Latency | Wait time (creation to claim) and execution time percentiles per queue. |
| Dispatcher & claims | Claim query latency and batch size, wake-ups by reason, empty claims, rate limiting, completion flush time. |
| Rescues, DLQ & database retries | Rescues by kind (stale heartbeat, deadline, callback timeout), DLQ inflow and depth, deadlock and database-unavailability retries. |
| Maintenance leader | Whether exactly one runtime is running maintenance, which one, and how long each branch takes. A slow branch delays promotion, rescue and rotation. |
| Ring rotation & prune | Rotation and prune outcomes, what blocks them, prune phase latency. |
| Job outputs & follow-ups (0.7+), Descriptor catalogs, Storage transition | Collapsed by default. |
Panels backed by metrics that a release does not emit render empty; the job output, staged follow-up, awa_completion_reconnect_retry_total and prune duration series arrive in 0.7.
Fleets can have hundreds of queues, so the per-queue panels (queue lag, deepest queues, deferred backlog, throughput, in-flight and claim rate by queue, top kinds, and the queue detail dashboard's other-queue panels) draw the ten series with the highest value over the selected time range. The set is fixed for the whole range, and the legend is a table sorted by its maximum. Use the Queue variable to look at a specific queue.
Event counters such as failures, retries, DLQ moves and parked jobs only exist after their first event, so those panels read "None in range" on a healthy fleet.
Quantiles of the duration histograms (job duration, claim latency, wake-to-first-claim, completion flush, promotion duration) need AWA 0.6.13 or later; earlier versions export buckets that are too coarse below 5 s. Each of those panels also plots a dashed mean series, which is correct on every version.
Panel reference
| Panel | Type | What it shows |
|---|---|---|
| Queue Lag | Time series | Age of the oldest available job per queue; on queue storage, of the oldest next-to-claim job across its lanes (the admin UI shows the oldest overall) |
| Queue Depth | Stacked time series | Current jobs by queue and state (available, running, failed, scheduled, retryable, waiting external) |
| Job Wait Time (p50/p95/p99) | Time series | Time from job creation to claim |
| Job Throughput | Time series | Completed, failed, retried, cancelled jobs/sec |
| In-Flight Jobs | Time series | Currently executing jobs by queue (stacked) |
| Job Duration (p50/p95/p99) | Time series | Execution time percentiles by queue |
| Throughput by Kind (top 10) | Stacked bars | Completed jobs/sec by job kind (capped at 10) |
| Claim Latency | Time series | Postgres dequeue query time (p50/p95) |
| Claim Batch Size | Time series | Average jobs claimed per poll cycle |
| Maintenance Rescues | Bars | Heartbeat, deadline, callback_timeout rescues |
| Completion Flush Performance | Time series | Batch completion write latency |
| Promotion Throughput | Time series | Scheduled/retryable jobs promoted per second |
| Job Outputs | Time series | Outputs published per second by outcome, and dropped outputs by reason |
| Job Output Size (p50/p95) | Time series | Size of published outputs in bytes of JSON text |
| Staged Follow-ups | Time series | Handler-staged follow-ups inserted, skipped as duplicates, or discarded by WaitForCallback, per second |
| Prune Database Phase Latency p99 | Time series | Ring prune lock, TRUNCATE, and commit latency by ring |
| Claims / Waiting External | Time series | Queue claim rate and callback-parked job rate |
| Error Rate | Stat | Failed / (completed + failed) percentage |
| Jobs In Flight | Stat | Total executing jobs with threshold colours |
| Throughput | Stat | Total completed/sec (5m average) |
| Rescues (5m) | Stat | Recent rescue count with threshold colours |
Color semantics are consistent across panels: green for healthy/fast paths, orange for warning/tail latency or retries, red for failures/high tail latency, blue for queue intake/backlog, and yellow for callback/external wait states.
What the dashboards cannot show
- Due-but-unpromoted work.
awa_queue_depth{awa_job_state="scheduled"}counts every deferred job, due or not, and queue lag only sees jobs already in the ready lanes. A stall in promotion shows up as the deferred backlog growing while the promotion rate is flat, not as a direct number. - Maintenance leader identity. No metric names the leader. The Maintenance leader row infers it from which series is running maintenance branches, so it needs a per-runtime label (
instance, pod or similar) from your pipeline. - Runtime versions. No metric reports the awa version a runtime runs.
- Maintenance task failures. Failed promotion, rescue or prune queries are logged, not counted.
Setup
1. Configure OTLP export in your worker
// In your worker binary, before starting the client:
use opentelemetry_otlp::WithExportConfig;
use opentelemetry_sdk::metrics::SdkMeterProvider;

let exporter = opentelemetry_otlp::MetricExporter::builder()
    .with_tonic()
    .with_endpoint("http://localhost:4317")
    .build()?;

let provider = SdkMeterProvider::builder()
    .with_periodic_exporter(exporter)
    .build();

opentelemetry::global::set_meter_provider(provider);
2. Import the dashboard
Option A: Grafana UI
- Open Grafana (default: http://localhost:3000)
- Go to Dashboards → Import
- Upload
awa-dashboard.json, then repeat forawa-queue-detail.json - Choose the Prometheus datasource with the Datasource variable at the top of the dashboard
Option B: Provisioning Copy awa-dashboard.json and awa-queue-detail.json to the directory a Grafana dashboard provider reads. The dashboards need no datasource substitution: the datasource variable defaults to your default Prometheus datasource.
Option C: API
# The Grafana API requires a wrapper object around the dashboard JSON
for dashboard in awa-dashboard.json awa-queue-detail.json; do
  curl -X POST "http://admin:admin@localhost:3000/api/dashboards/db" \
    -H "Content-Type: application/json" \
    -d "{\"dashboard\": $(cat $dashboard), \"overwrite\": true}"
done
3. Verify metrics are flowing
Check Prometheus has awa metrics:
Expected metrics: awa_job_completed_total, awa_job_in_flight, awa_job_duration_seconds_*, etc.
4. Traces
With trace propagation enabled (ADR-039; automatic when your producer runs
an OpenTelemetry pipeline), the runtime's send {queue} and
job.execute {kind} spans arrive alongside the metrics — browse them in
Grafana under Explore → Tempo, or search TraceQL like
{ span.messaging.system = "awa" }.
Worker-side, each dispatcher poll roots its own trace at receive {queue}
(consumer kind, same messaging attributes, so the TraceQL above finds it) and
each heartbeat tick roots one at heartbeat.tick. Both are debug, so an
info pipeline shows neither — they tick whether or not there is work, and at
the default poll interval that would be ~5 traces/s per queue-claimer. Raise the
filter when you want them; see
Worker-side traces.
Spans and log events for work on a specific queue carry both queue and the
OTel messaging.destination.name, so
{ span.messaging.destination.name = "email" } finds the messaging spans and the
queue_storage.* claim/count spans together. Bulk DLQ operations
(bulk_move_failed_to_dlq, bulk_retry_from_dlq) carry only queue, because
theirs is an optional filter rather than a destination — query those by queue.
The bare key is retained everywhere for existing queries
(#454 tracks whether it is
eventually dropped).
Keeping these assets honest
These dashboards and alert rules are validated in CI against a live LGTM
stack on every full run (scripts/validate-grafana.sh): every awa_*
identifier they reference must exist in Prometheus (or still be defined in
awa-metrics for condition-gated metrics), both dashboards must import
through the Grafana API, every Postgres panel's SQL must EXPLAIN against
a migrated schema, and a trace must be readable through Grafana's Tempo
datasource. Run the whole thing locally with scripts/telemetry-e2e-local.sh.
Metrics Reference
All metrics use the awa OTel meter name and are exported via OTLP to your configured collector.
In Prometheus they appear under the OpenTelemetry OTLP-to-Prometheus translation, which the collector's Prometheus exporter applies by default: dots become underscores, the unit is appended (s → _seconds, By → _bytes; annotations such as {job} are dropped), counters end in _total, and histograms export _bucket, _sum and _count. So awa.job.duration (unit s) is queried as awa_job_duration_seconds_bucket, and the attribute awa.job.queue as the label awa_job_queue. scripts/otel-prometheus-names.py prints every series and label name awa exports; scripts/validate-grafana.sh checks the shipped dashboard and alert rules against that list and against a live Prometheus.
Job lifecycle
| Metric | Type | Labels | Description |
|---|---|---|---|
awa.job.completed |
Counter | kind, queue | Jobs completed |
awa.job.failed |
Counter | kind, queue, terminal | Jobs failed |
awa.job.retried |
Counter | kind, queue | Jobs retried |
awa.completion.deadlock_retry |
Counter | kind, queue | Re-runs of a finalize transaction after Postgres aborted it as a deadlock victim (SQLSTATE 40P01); one increment per retry, up to three per completion. Any sustained rate means job transitions are waiting on each other |
awa.completion.reconnect_retry |
Counter | kind, queue | Retries of a lease-guarded finalization after database unavailability, including transport/TLS/protocol errors, pool-acquire timeouts, SQLSTATE 08xxx, 57P01–57P03 and 25006. Counts retries that start, rather than recovered jobs. A burst can indicate an outage or pool pressure; correlate with pool wait and database errors |
awa.job.staged_follow_ups_committed |
Counter | kind, queue, awa.follow_up.result |
Staged follow-ups (ADR-046) of committed completions: inserted, or duplicate when a job with the same unique key already existed. Recorded after the completion transaction commits, so a stale attempt counts nothing |
awa.job.staged_follow_ups_discarded |
Counter | kind, queue | Follow-ups a handler staged (ADR-046) and then discarded by returning WaitForCallback, which parks the job without completing it. Almost always a handler bug: stage after ctx.wait_for_callback instead |
awa.job.output_recorded |
Counter | kind, queue, outcome | Job outputs (ADR-048) published: completed as the job's output, failed in an error entry |
awa.job.output_size |
Histogram | kind, queue, outcome | Size of published job outputs, in bytes of JSON text |
awa.job.output_dropped |
Counter | kind, queue, awa.output.reason |
Outputs that were not published: canonical, schema_missing (a binary ahead of migration v052), outcome (Snooze or WaitForCallback), abandoned, no_claim, and too_large / invalid for each recording the handler made that was rejected |
awa.job.cancelled |
Counter | kind, queue | Jobs cancelled |
awa.job.claimed |
Counter | queue | Jobs claimed from DB |
awa.job.in_flight |
UpDownCounter | queue | Currently executing |
awa.job.duration |
Histogram (s) | kind, queue | Execution time |
awa.job.wait_duration |
Histogram (s) | kind, queue | Time from creation to claim; explicit buckets include 1ms, 5ms, 10ms, 25ms, 50ms, 100ms, 250ms, 500ms, and 1s |
awa.job.waiting_external |
Counter | kind, queue | Parked for callback |
Dispatcher
| Metric | Type | Labels | Description |
|---|---|---|---|
awa.dispatch.claim_batches |
Counter | queue | Claim queries |
awa.dispatch.claim_batch_size |
Histogram | queue | Jobs per claim |
awa.dispatch.claim_duration |
Histogram (s) | queue | Claim query time |
Completion batcher
| Metric | Type | Labels | Description |
|---|---|---|---|
awa.completion.flushes |
Counter | shard | Flush operations |
awa.completion.flush_batch_size |
Histogram | shard | Jobs per flush |
awa.completion.flush_duration |
Histogram (s) | shard | Flush time |
Maintenance
| Metric | Type | Labels | Description |
|---|---|---|---|
awa.maintenance.promote_batches |
Counter | state | Promotion batches |
awa.maintenance.promote_batch_size |
Histogram | state | Jobs promoted |
awa.maintenance.promote_duration |
Histogram (s) | state | Promotion time |
awa.maintenance.rescues |
Counter | rescue_kind | Jobs rescued |
awa.maintenance.prune.attempts |
Counter | ring, outcome, reason | Ring prune outcomes, including destructive pruned and no-DDL already_pruned |
awa.maintenance.prune.duration |
Histogram (s) | ring, phase | Successful destructive prune time split into lock, truncate, and commit |
Heartbeat
| Metric | Type | Labels | Description |
|---|---|---|---|
awa.heartbeat.batches |
Counter | — | Heartbeat updates |
Descriptors (info-style gauges)
Emitted on every runtime_snapshot_interval tick. Value is always 1; the useful payload is the label set. Use with group_left joins to enrich other panels (see the "Descriptor metrics on the OTel dashboard" section above).
| Metric | Type | Labels | Description |
|---|---|---|---|
awa.queue.info |
Gauge | queue, display_name?, description?, owner?, docs_url?, tags? | Declared queue descriptor (label-join target) |
awa.job_kind.info |
Gauge | kind, display_name?, description?, owner?, docs_url?, tags? | Declared job-kind descriptor (label-join target) |
Optional labels are only emitted when the corresponding descriptor field is set (no empty-string series).